Reports
Today, this week, the leaderboard
Overview
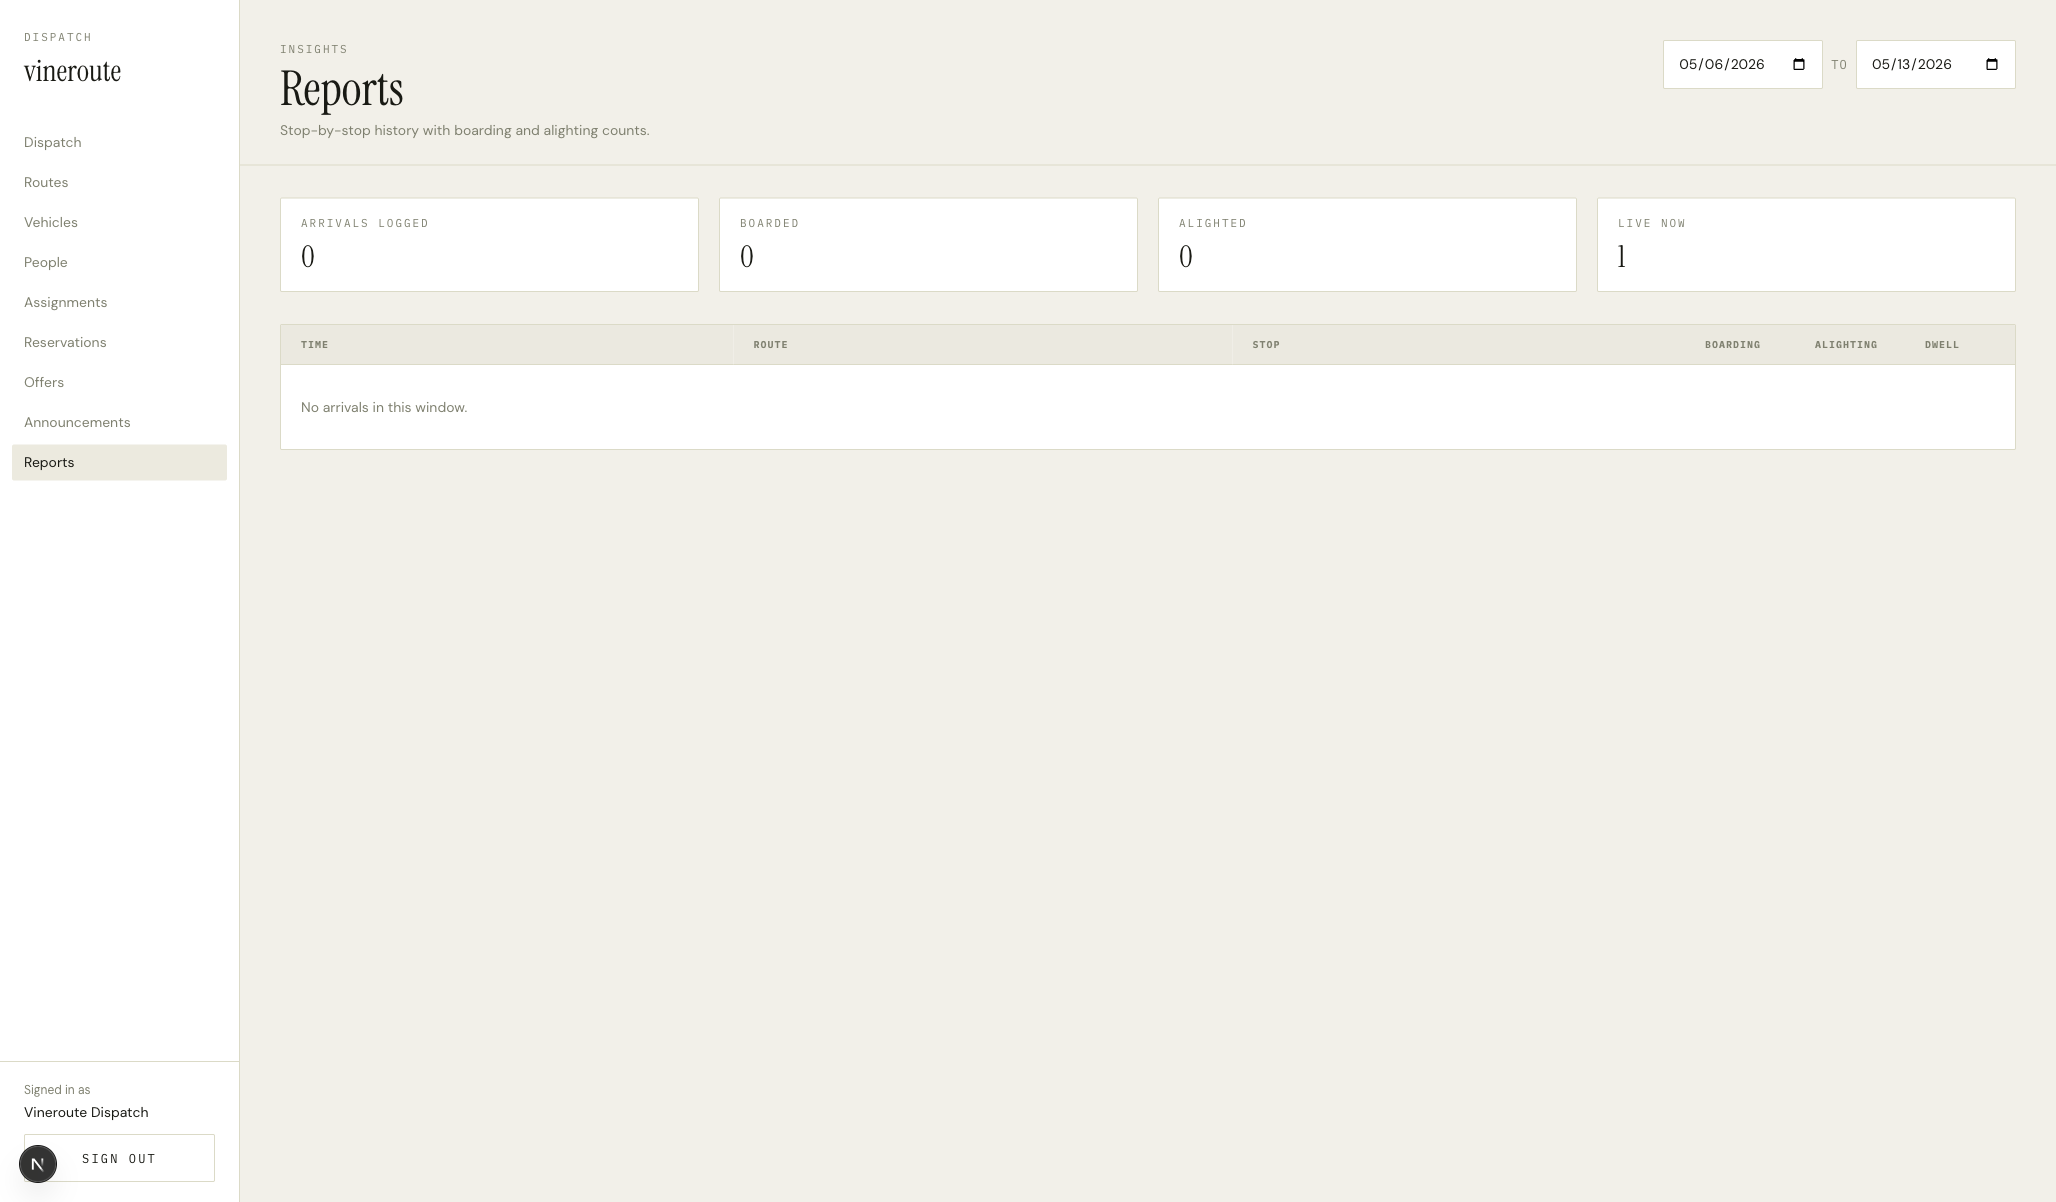
Page header REPORTS / Snapshot. Three columns: TODAY (passengers carried, trips completed, miles), THIS WEEK (a small bar list of trips per day), DRIVERS (a leaderboard ranked by tours-completed). All numbers from the same `GET /admin/reports/snapshot` endpoint, which does the math server-side.
How it works
Single query: `GET /admin/reports/snapshot` returns today, thisWeek, drivers with everything pre-aggregated server-side. The client just renders.
Today's totals are computed from the tripLogs and reservations tables — joined by date and route, summed.
Week breakdown is an array of 7 days; each entry is dateISO, trips, passengers. We render a list with subtle background bars sized to the max.
Driver leaderboard reads users.toursCompleted directly — incremented in a server-side mutation when a shift's status flips to completed.
Skeleton state uses the same cream placeholders as the rest of the admin — three card-shaped blocks with internal skeleton bars while the query is in flight.
Key decisions
Server-side aggregation, not client-side
We could have pulled raw rows and aggregated in JS, but that pushes load to every dispatcher's laptop and bloats the response. Doing the math in SQL keeps the page snappy and means the same numbers show identically across admins.
One snapshot, not three pages
A reports section could have grown into ten subpages — by-route, by-driver, by-month, by-vehicle. We shipped one snapshot that answers the questions a dispatcher actually has at 9am: how was yesterday, who's leading, what's this week look like. We'll add depth when it's earned.